> ## Documentation Index
> Fetch the complete documentation index at: https://docs.orq.ai/llms.txt
> Use this file to discover all available pages before exploring further.
# Application logs
> Send OpenTelemetry log records to Orq.ai and search them in the Logs Explorer, filtered by trace ID.
**Orq.ai** Logs stores the OpenTelemetry log records an application exports, alongside the [Traces](/ai-studio/observability/traces) that **Orq.ai** already collects. A trace shows the steps of a request; a log record carries a timestamped message from application code. Records that hold the active `trace_id` and `span_id` can be filtered by **Trace ID** in the **Logs Explorer**.
Logs arrive over the same OTLP endpoint as traces, as a separate signal. The endpoint accepts the OTLP logs signal at `/v2/otel/v1/logs`. Open **Logs** from the [AI Studio](https://my.orq.ai) sidebar to search the stored records.
## Prerequisites
* An **Orq.ai** workspace and an API key. Create one under **Settings > Organization > [API Keys](/ai-studio/organization/api-keys)** and export it as `ORQ_API_KEY`.
* The OpenTelemetry logging SDK and the OTLP HTTP exporter for the language in use.
## Send logs
Exporters read the endpoint and headers from the environment. Set both, plus the resource attributes that identify the service:
```bash macOS / Linux theme={"theme":{"light":"github-light","dark":"github-dark"}}
export OTEL_EXPORTER_OTLP_ENDPOINT="https://my.orq.ai/v2/otel"
export OTEL_EXPORTER_OTLP_HEADERS="Authorization=Bearer $ORQ_API_KEY"
export OTEL_RESOURCE_ATTRIBUTES="service.name=my-app,service.version=1.0.0"
```
```powershell Windows theme={"theme":{"light":"github-light","dark":"github-dark"}}
$env:OTEL_EXPORTER_OTLP_ENDPOINT = "https://my.orq.ai/v2/otel"
$env:OTEL_EXPORTER_OTLP_HEADERS = "Authorization=Bearer $env:ORQ_API_KEY"
$env:OTEL_RESOURCE_ATTRIBUTES = "service.name=my-app,service.version=1.0.0"
```
The OpenTelemetry logging SDK appends `/v1/logs` to the base endpoint, so the records reach `https://my.orq.ai/v2/otel/v1/logs`. See [Base URLs](/reference/base-urls) for self-hosted deployments.
Create a logger provider, attach the OTLP exporter, and bridge the standard application logger to it:
```python Python theme={"theme":{"light":"github-light","dark":"github-dark"}}
import logging
from opentelemetry._logs import set_logger_provider
from opentelemetry.exporter.otlp.proto.http._log_exporter import OTLPLogExporter
from opentelemetry.sdk._logs import LoggerProvider, LoggingHandler
from opentelemetry.sdk._logs.export import BatchLogRecordProcessor
provider = LoggerProvider()
provider.add_log_record_processor(BatchLogRecordProcessor(OTLPLogExporter()))
set_logger_provider(provider)
logging.basicConfig(level=logging.INFO)
logging.getLogger().addHandler(
LoggingHandler(level=logging.INFO, logger_provider=provider)
)
logging.getLogger("checkout-service").info(
"Order processed", extra={"order.id": "A-1024"}
)
```
```typescript TypeScript theme={"theme":{"light":"github-light","dark":"github-dark"}}
import { logs, SeverityNumber } from '@opentelemetry/api-logs';
import { LoggerProvider, BatchLogRecordProcessor } from '@opentelemetry/sdk-logs';
import { OTLPLogExporter } from '@opentelemetry/exporter-logs-otlp-http';
const loggerProvider = new LoggerProvider();
loggerProvider.addLogRecordProcessor(
new BatchLogRecordProcessor(new OTLPLogExporter()),
);
logs.setGlobalLoggerProvider(loggerProvider);
const logger = logs.getLogger('checkout-service');
logger.emit({
severityNumber: SeverityNumber.INFO,
severityText: 'INFO',
body: 'Order processed',
attributes: { 'order.id': 'A-1024' },
});
```
Install the exporter and SDK packages first: `pip install opentelemetry-sdk opentelemetry-exporter-otlp-proto-http` for Python, or `npm install @opentelemetry/api-logs @opentelemetry/sdk-logs @opentelemetry/exporter-logs-otlp-http` for Node.js.
When a record is emitted while a span is active, the exporter attaches that span's `trace_id` and `span_id`. Filter the **Logs Explorer** by **Trace ID** to pull every record for one request, or read them over the API with [List logs for a trace](/reference/logs/list-logs-for-a-trace). Records emitted outside a span carry no trace context and stay searchable by their other fields only.
## Log records
The **Logs Explorer** shows one row per record. Toggle additional columns from the fields panel.
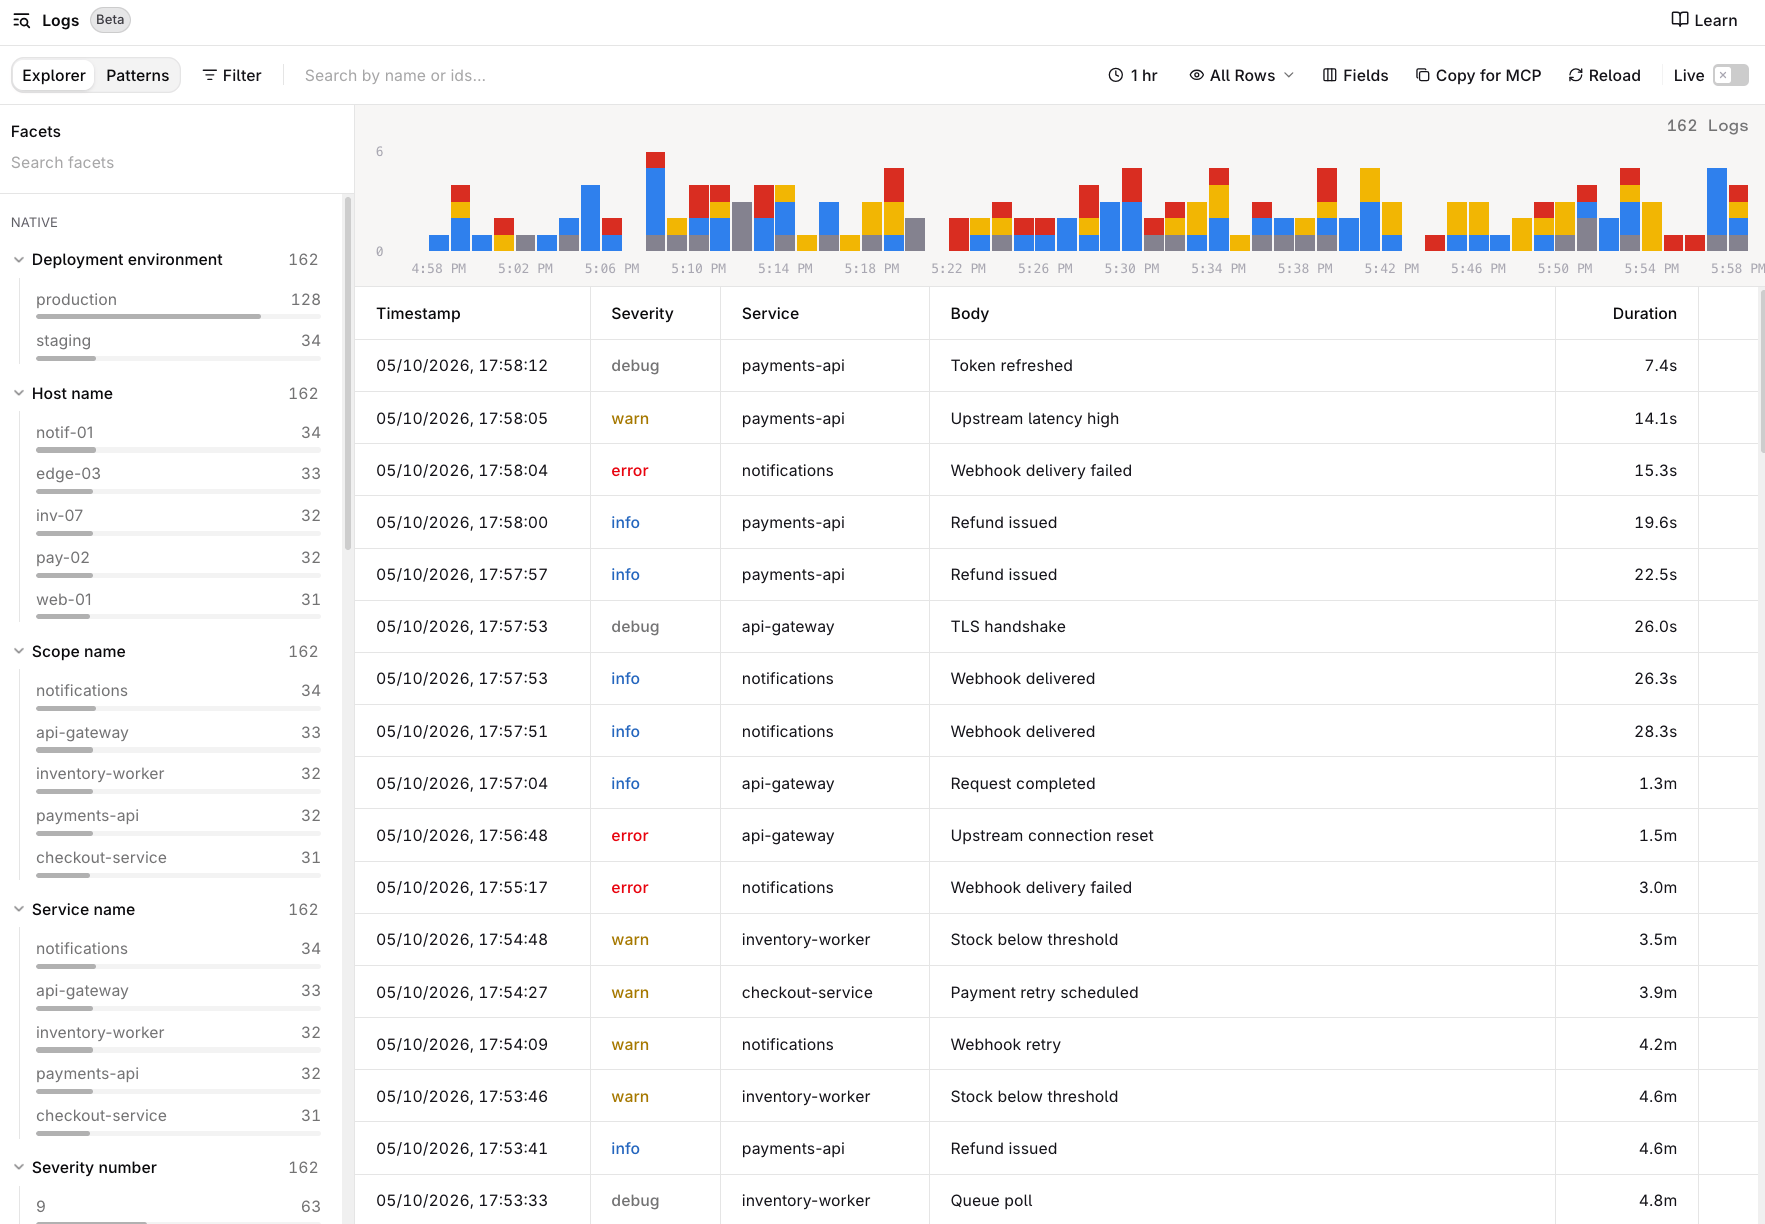 | Column | Record field | Notes |
| - | - | - |
| **Timestamp** | `timestamp` | When the event occurred |
| **Severity** | `severity_text` and `severity_number` | Uses the text, lowercased, when set, otherwise derived from the numeric severity |
| **Service** | `service_name` | Promoted from the `service.name` resource attribute |
| **Body** | `body` | The message, or the JSON payload when the body is structured |
| **Duration** | `observed_timestamp` minus `timestamp` | The time between the event and its ingestion |
| **Event** | `event_name` | The event name, when set |
| **Scope** | `scope_name` | The instrumentation scope that emitted the record |
| **Environment** | `deployment_environment` | Promoted from `deployment.environment` or `deployment.environment.name` |
| **Host** | `host_name` | Promoted from `host.name` |
| **Project** | `project_id` | The project that received the export |
| **Trace ID** | `trace_id` | The active trace, when one was present |
| **Span ID** | `span_id` | The active span, when one was present |
Attributes stay grouped by origin and are searchable in the fields panel and filter menu:
* **Log attributes**: attributes set on the individual record, for example `order.id`.
* **Resource attributes**: attributes set for the whole process, for example `service.name` or `deployment.environment`.
* **Scope attributes**: attributes set by the instrumentation library.
An OTLP export carries this shape:
```json theme={"theme":{"light":"github-light","dark":"github-dark"}}
{
"resourceLogs": [
{
"resource": {
"attributes": [
{ "key": "service.name", "value": { "stringValue": "checkout-service" } }
]
},
"scopeLogs": [
{
"scope": { "name": "checkout-service" },
"logRecords": [
{
"timeUnixNano": "1759600000000000000",
"severityNumber": 9,
"severityText": "INFO",
"body": { "stringValue": "Order processed" },
"attributes": [
{ "key": "order.id", "value": { "stringValue": "A-1024" } }
],
"traceId": "4bf92f3577b34da6a3ce929d0e0e4736",
"spanId": "00f067aa0ba902b7"
}
]
}
]
}
]
}
```
## Frameworks
Any OpenTelemetry logging SDK that exports OTLP over HTTP can send to **Orq.ai**: the signal is independent of the tracing instrumentation, so logs from a framework that only instruments traces still arrive once the logging SDK is configured in the same process.
The [framework guides](/ai-studio/integrations/frameworks/overview) configure the traces signal. Add the logging SDK setup above to the same process to export logs alongside those traces; the active span context keeps both correlated.
## Query logs
The **Logs Explorer** supports free-text search, filters over native and dynamic fields, and pattern detection over a bounded sample. Saved filter combinations are reusable views.
The same data is available programmatically:
* The [Logs API](/reference/logs/search-logs) for filtering, aggregation, and facets, and [OQL](/ai-studio/observability/oql) for pipeline queries.
* The [Telemetry API](/ai-studio/observability/telemetry-api) for cross-signal queries.
* The **Orq MCP** server exposes `search_logs`, `get_log`, and `find_log_patterns` to coding assistants.
## Limits
| Limit | Value | Behaviour when exceeded |
| - | - | - |
| Records per export request | 10,000 | The request is rejected with `413` |
| Attributes per attribute list | 128 | The excess is dropped |
| Attribute key length | Longer than 512 bytes | The key is dropped |
| Request body size | 64 MB | The request is rejected with `413` after decompression |
| Free-plan ingestion | Plan quota | The request is rejected with `429` and a `Retry-After` header |
A retried export is deduplicated against the same batch positions, so a resent batch does not create duplicates. Identical lines within one export stay distinct.
This documentation is built and hosted on [Mintlify](https://mintlify.com), a developer documentation platform.
| Column | Record field | Notes |
| - | - | - |
| **Timestamp** | `timestamp` | When the event occurred |
| **Severity** | `severity_text` and `severity_number` | Uses the text, lowercased, when set, otherwise derived from the numeric severity |
| **Service** | `service_name` | Promoted from the `service.name` resource attribute |
| **Body** | `body` | The message, or the JSON payload when the body is structured |
| **Duration** | `observed_timestamp` minus `timestamp` | The time between the event and its ingestion |
| **Event** | `event_name` | The event name, when set |
| **Scope** | `scope_name` | The instrumentation scope that emitted the record |
| **Environment** | `deployment_environment` | Promoted from `deployment.environment` or `deployment.environment.name` |
| **Host** | `host_name` | Promoted from `host.name` |
| **Project** | `project_id` | The project that received the export |
| **Trace ID** | `trace_id` | The active trace, when one was present |
| **Span ID** | `span_id` | The active span, when one was present |
Attributes stay grouped by origin and are searchable in the fields panel and filter menu:
* **Log attributes**: attributes set on the individual record, for example `order.id`.
* **Resource attributes**: attributes set for the whole process, for example `service.name` or `deployment.environment`.
* **Scope attributes**: attributes set by the instrumentation library.
An OTLP export carries this shape:
```json theme={"theme":{"light":"github-light","dark":"github-dark"}}
{
"resourceLogs": [
{
"resource": {
"attributes": [
{ "key": "service.name", "value": { "stringValue": "checkout-service" } }
]
},
"scopeLogs": [
{
"scope": { "name": "checkout-service" },
"logRecords": [
{
"timeUnixNano": "1759600000000000000",
"severityNumber": 9,
"severityText": "INFO",
"body": { "stringValue": "Order processed" },
"attributes": [
{ "key": "order.id", "value": { "stringValue": "A-1024" } }
],
"traceId": "4bf92f3577b34da6a3ce929d0e0e4736",
"spanId": "00f067aa0ba902b7"
}
]
}
]
}
]
}
```
## Frameworks
Any OpenTelemetry logging SDK that exports OTLP over HTTP can send to **Orq.ai**: the signal is independent of the tracing instrumentation, so logs from a framework that only instruments traces still arrive once the logging SDK is configured in the same process.
The [framework guides](/ai-studio/integrations/frameworks/overview) configure the traces signal. Add the logging SDK setup above to the same process to export logs alongside those traces; the active span context keeps both correlated.
## Query logs
The **Logs Explorer** supports free-text search, filters over native and dynamic fields, and pattern detection over a bounded sample. Saved filter combinations are reusable views.
The same data is available programmatically:
* The [Logs API](/reference/logs/search-logs) for filtering, aggregation, and facets, and [OQL](/ai-studio/observability/oql) for pipeline queries.
* The [Telemetry API](/ai-studio/observability/telemetry-api) for cross-signal queries.
* The **Orq MCP** server exposes `search_logs`, `get_log`, and `find_log_patterns` to coding assistants.
## Limits
| Limit | Value | Behaviour when exceeded |
| - | - | - |
| Records per export request | 10,000 | The request is rejected with `413` |
| Attributes per attribute list | 128 | The excess is dropped |
| Attribute key length | Longer than 512 bytes | The key is dropped |
| Request body size | 64 MB | The request is rejected with `413` after decompression |
| Free-plan ingestion | Plan quota | The request is rejected with `429` and a `Retry-After` header |
A retried export is deduplicated against the same batch positions, so a resent batch does not create duplicates. Identical lines within one export stay distinct.
This documentation is built and hosted on [Mintlify](https://mintlify.com), a developer documentation platform.