

trace_id and span_id can be filtered by Trace ID in the Logs Explorer.
Logs arrive over the same OTLP endpoint as traces, as a separate signal. The endpoint accepts the OTLP logs signal at /v2/otel/v1/logs. Open Logs from the AI Studio sidebar to search the stored records.
Prerequisites
- An Orq.ai workspace and an API key. Create one under Settings > Organization > API Keys and export it as
ORQ_API_KEY. - The OpenTelemetry logging SDK and the OTLP HTTP exporter for the language in use.
Send logs
Set the endpoint and credentials
Exporters read the endpoint and headers from the environment. Set both, plus the resource attributes that identify the service:The OpenTelemetry logging SDK appends
/v1/logs to the base endpoint, so the records reach https://my.orq.ai/v2/otel/v1/logs. See Base URLs for self-hosted deployments.Configure the logging SDK
Create a logger provider, attach the OTLP exporter, and bridge the standard application logger to it:Install the exporter and SDK packages first:
pip install opentelemetry-sdk opentelemetry-exporter-otlp-proto-http for Python, or npm install @opentelemetry/api-logs @opentelemetry/sdk-logs @opentelemetry/exporter-logs-otlp-http for Node.js.Correlate logs with traces
When a record is emitted while a span is active, the exporter attaches that span’s
trace_id and span_id. Filter the Logs Explorer by Trace ID to pull every record for one request, or read them over the API with List logs for a trace. Records emitted outside a span carry no trace context and stay searchable by their other fields only.Log records
The Logs Explorer shows one row per record. Toggle additional columns from the fields panel.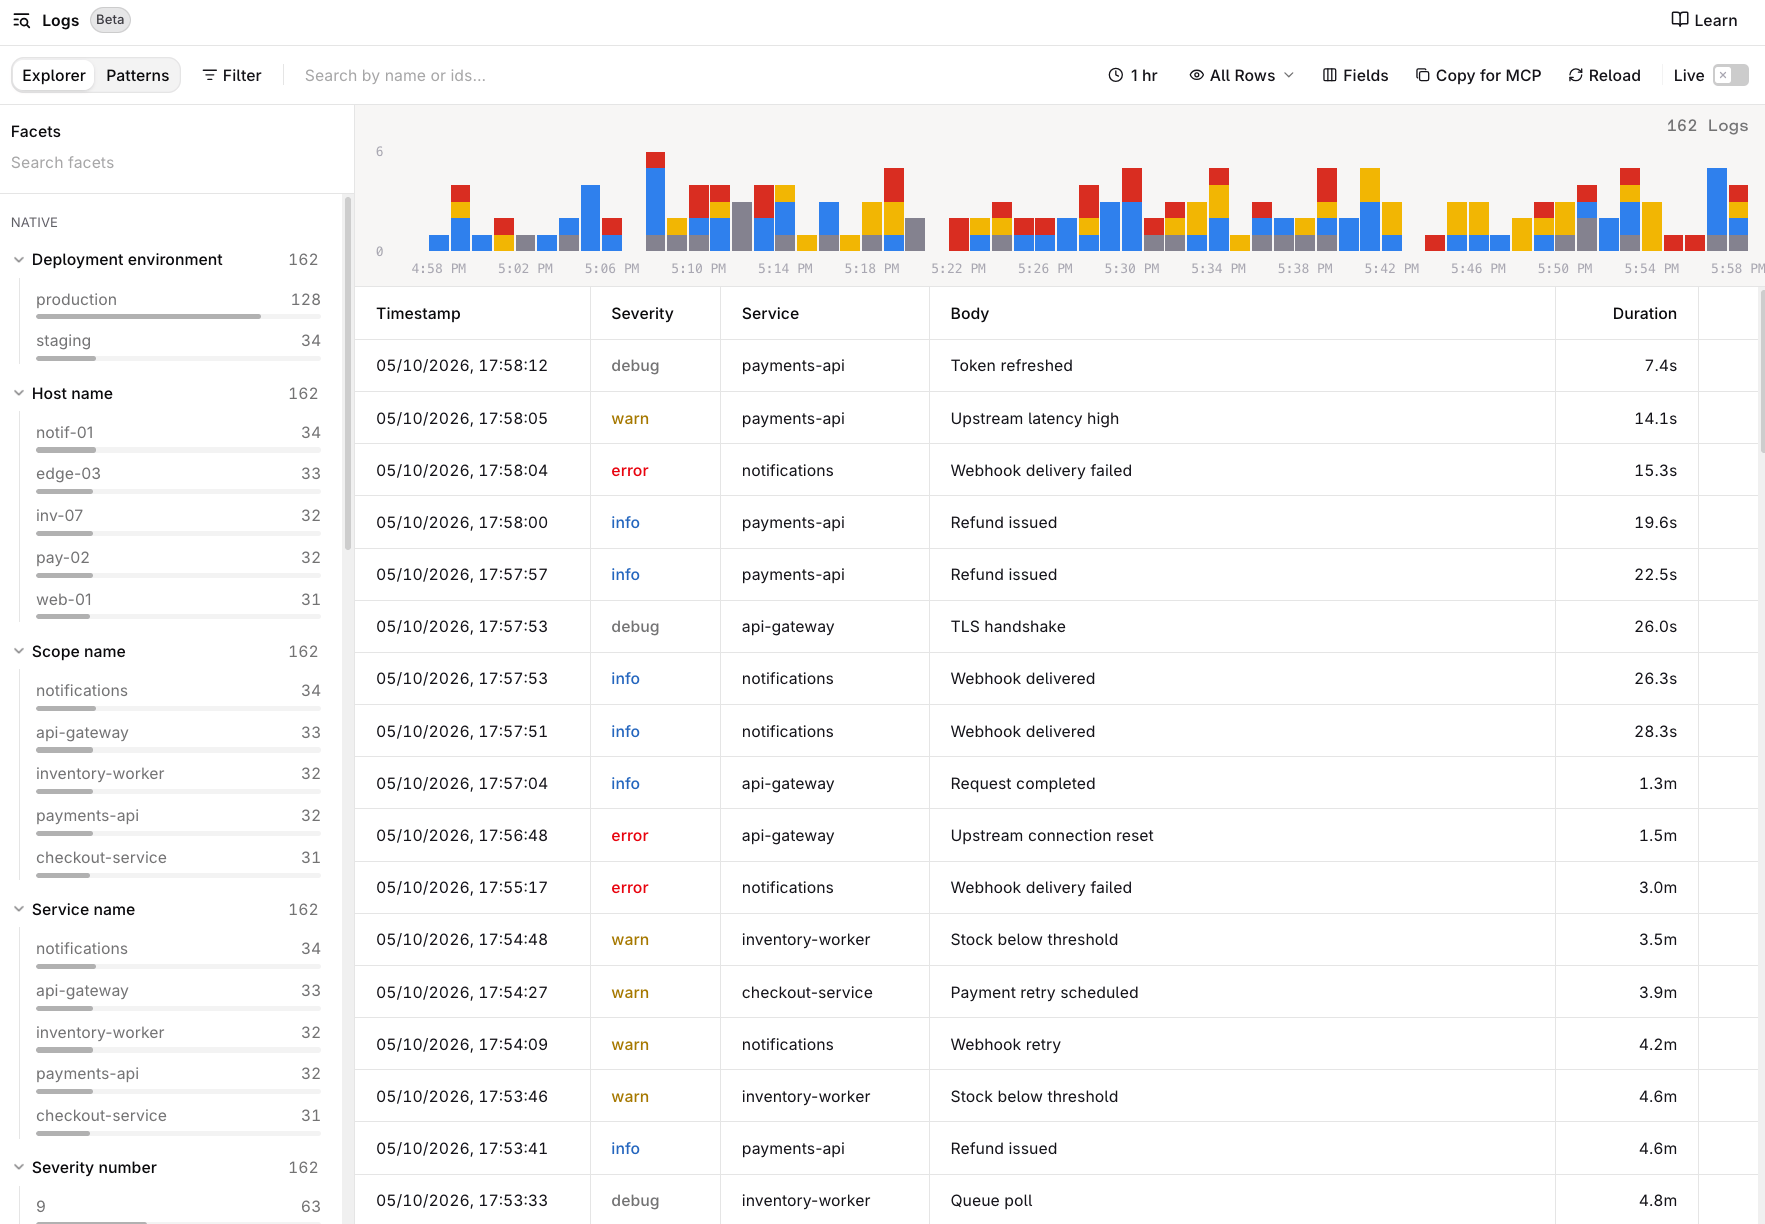
The Logs Explorer. Left: facets for deployment environment, host name, scope name, service name, and severity. Right: a severity histogram above the Logs table.
Attributes stay grouped by origin and are searchable in the fields panel and filter menu:
- Log attributes: attributes set on the individual record, for example
order.id. - Resource attributes: attributes set for the whole process, for example
service.nameordeployment.environment. - Scope attributes: attributes set by the instrumentation library.
Frameworks
Any OpenTelemetry logging SDK that exports OTLP over HTTP can send to Orq.ai: the signal is independent of the tracing instrumentation, so logs from a framework that only instruments traces still arrive once the logging SDK is configured in the same process. The framework guides configure the traces signal. Add the logging SDK setup above to the same process to export logs alongside those traces; the active span context keeps both correlated.Query logs
The Logs Explorer supports free-text search, filters over native and dynamic fields, and pattern detection over a bounded sample. Saved filter combinations are reusable views. The same data is available programmatically:- The Logs API for filtering, aggregation, and facets, and OQL for pipeline queries.
- The Telemetry API for cross-signal queries.
- The Orq MCP server exposes
search_logs,get_log, andfind_log_patternsto coding assistants.
Limits
A retried export is deduplicated against the same batch positions, so a resent batch does not create duplicates. Identical lines within one export stay distinct.