

What are Traces
Traces record every AI request handled by Orq.ai, from a single model call to a multi-step Agent run. Each trace shows the full workflow of one request as a tree of steps (spans), with inputs, outputs, latency, token usage and cost for each step. Traces are created for:- Model calls sent through the AI Gateway
- Agent runs, including sub-agent and tool calls
- Deployment invocations
- Coding sessions from code assistants connected to Orq.ai
- Application code instrumented with OpenTelemetry frameworks or the
@traceddecorator
- LLM calls, including Retries and Fallbacks
- Tool and sub-agent calls
- Evaluators and Guardrails
- Retrieval from a Knowledge Base, including Embeddings
- Caching
Creating Traces
Traces are generated automatically for requests through the AI Gateway, Agents and Deployments. Create custom traces for application code using framework instrumentation or the Orq.ai SDK.Framework Instrumentation
For popular AI frameworks and libraries, use automatic instrumentation with OpenTelemetry:Framework Integrations
Explore automatic instrumentation for OpenAI, LangChain, LlamaIndex, CrewAI, Autogen, and 15+ other frameworks with OpenTelemetry integration.
Custom Tracing using the @traced decorator
For custom functions or application workflows, use the@traced decorator from the Python SDK. It works with both synchronous and async functions:
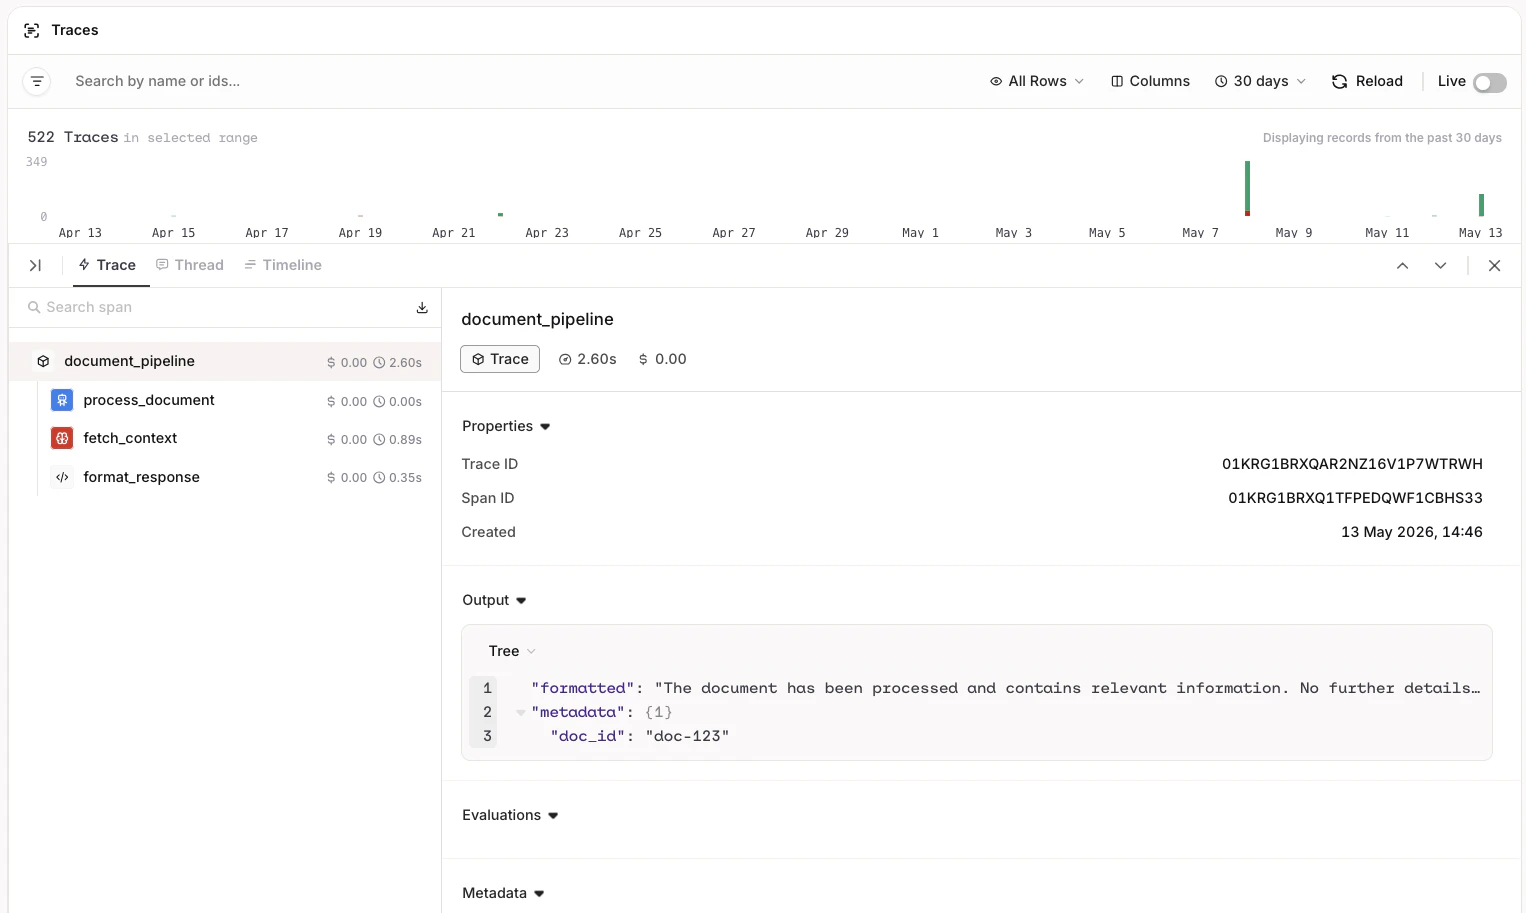
Custom trace with nested spans from @traced.
The
@traced decorator supports the following span types:Capture or suppress inputs/outputs with
capture_input and capture_output, and attach custom metadata with the attributes parameter:How to Lookup Traces
To find traces, open Traces in the Observability section of the sidebar. The page has three parts:- Query bar: search, filters, time range, and the Views, Fields, Review and Reload buttons.
- Activity chart: the number of Successful and Errors traces over the selected time range. Click a bar to zoom into that time window, then click to go back to the previous range.
- Traces table: one row per trace, newest first. Scroll down to load more traces.
Trace Views
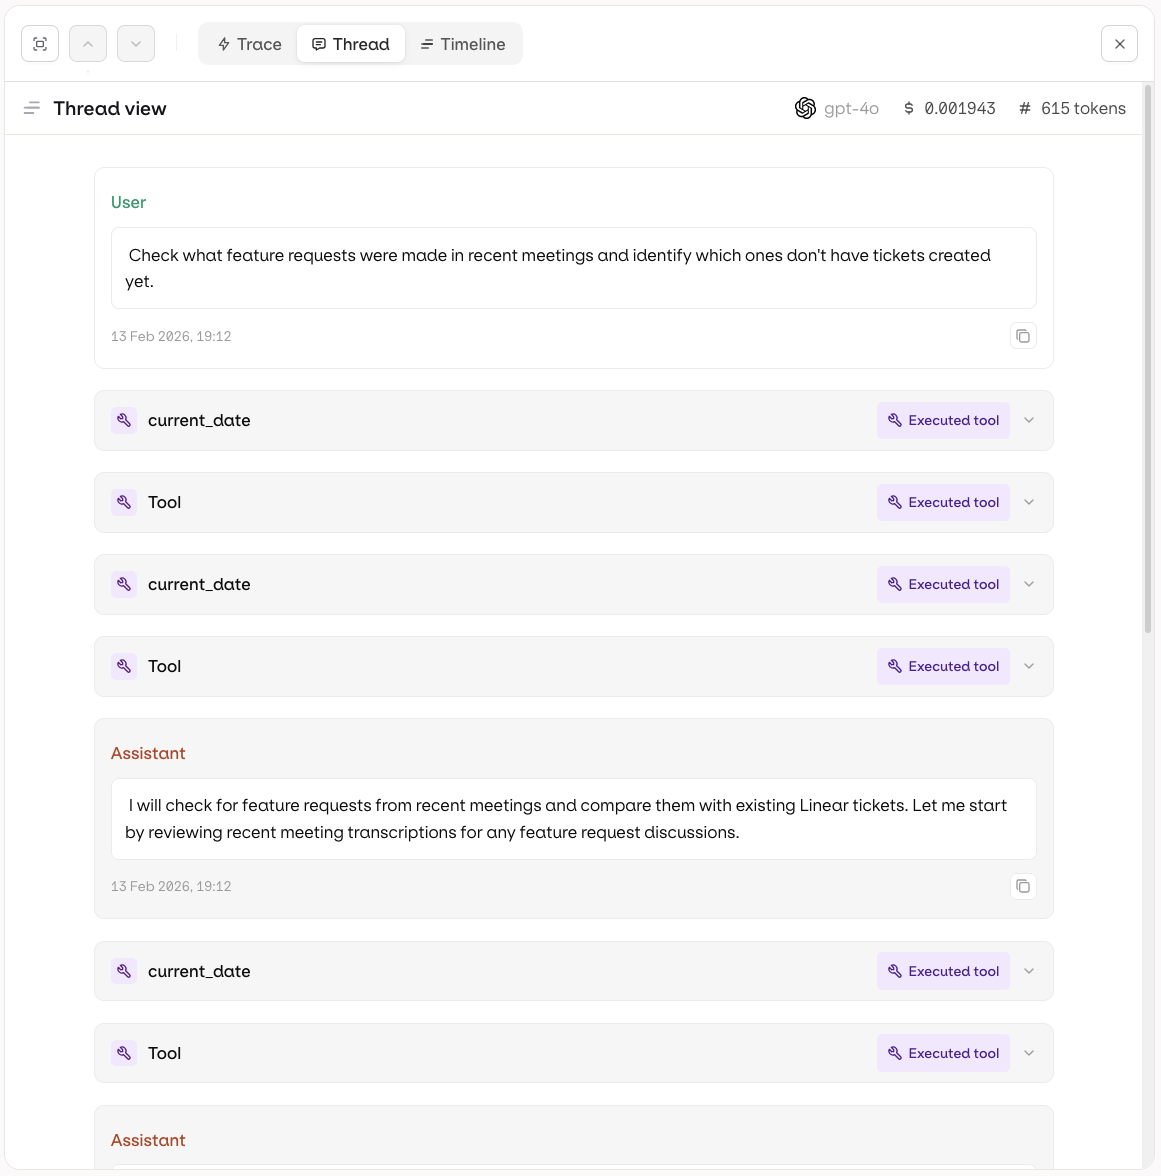
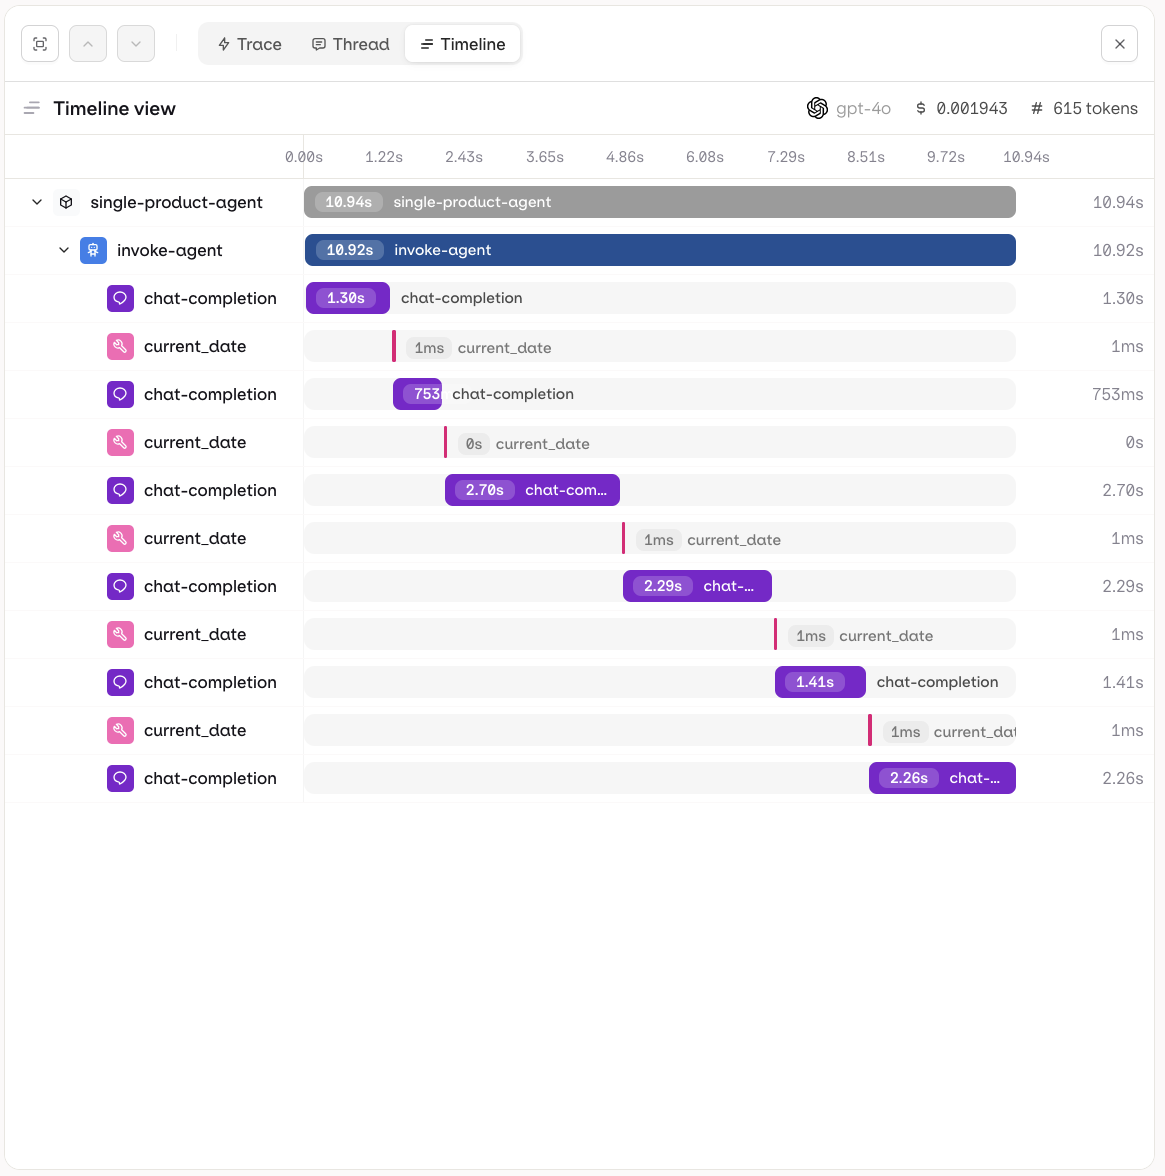
Each trace can be inspected in three views to suit different debugging and analysis needs.- Trace
- Thread
- Timeline
The Trace view shows the full execution tree for a single run. Each step is displayed hierarchically, including LLM calls, tool invocations, knowledge retrievals, and memory interactions. Use this view to inspect inputs, outputs, token usage, and latency at every step.For multi-agent runs, the hierarchy renders as an agent graph: parent agents and their sub-agent calls are shown as a nested tree, making it easy to follow how work was delegated across agents and where time was spent. See Agent Graphs for how graphs are produced and how to debug delegation paths.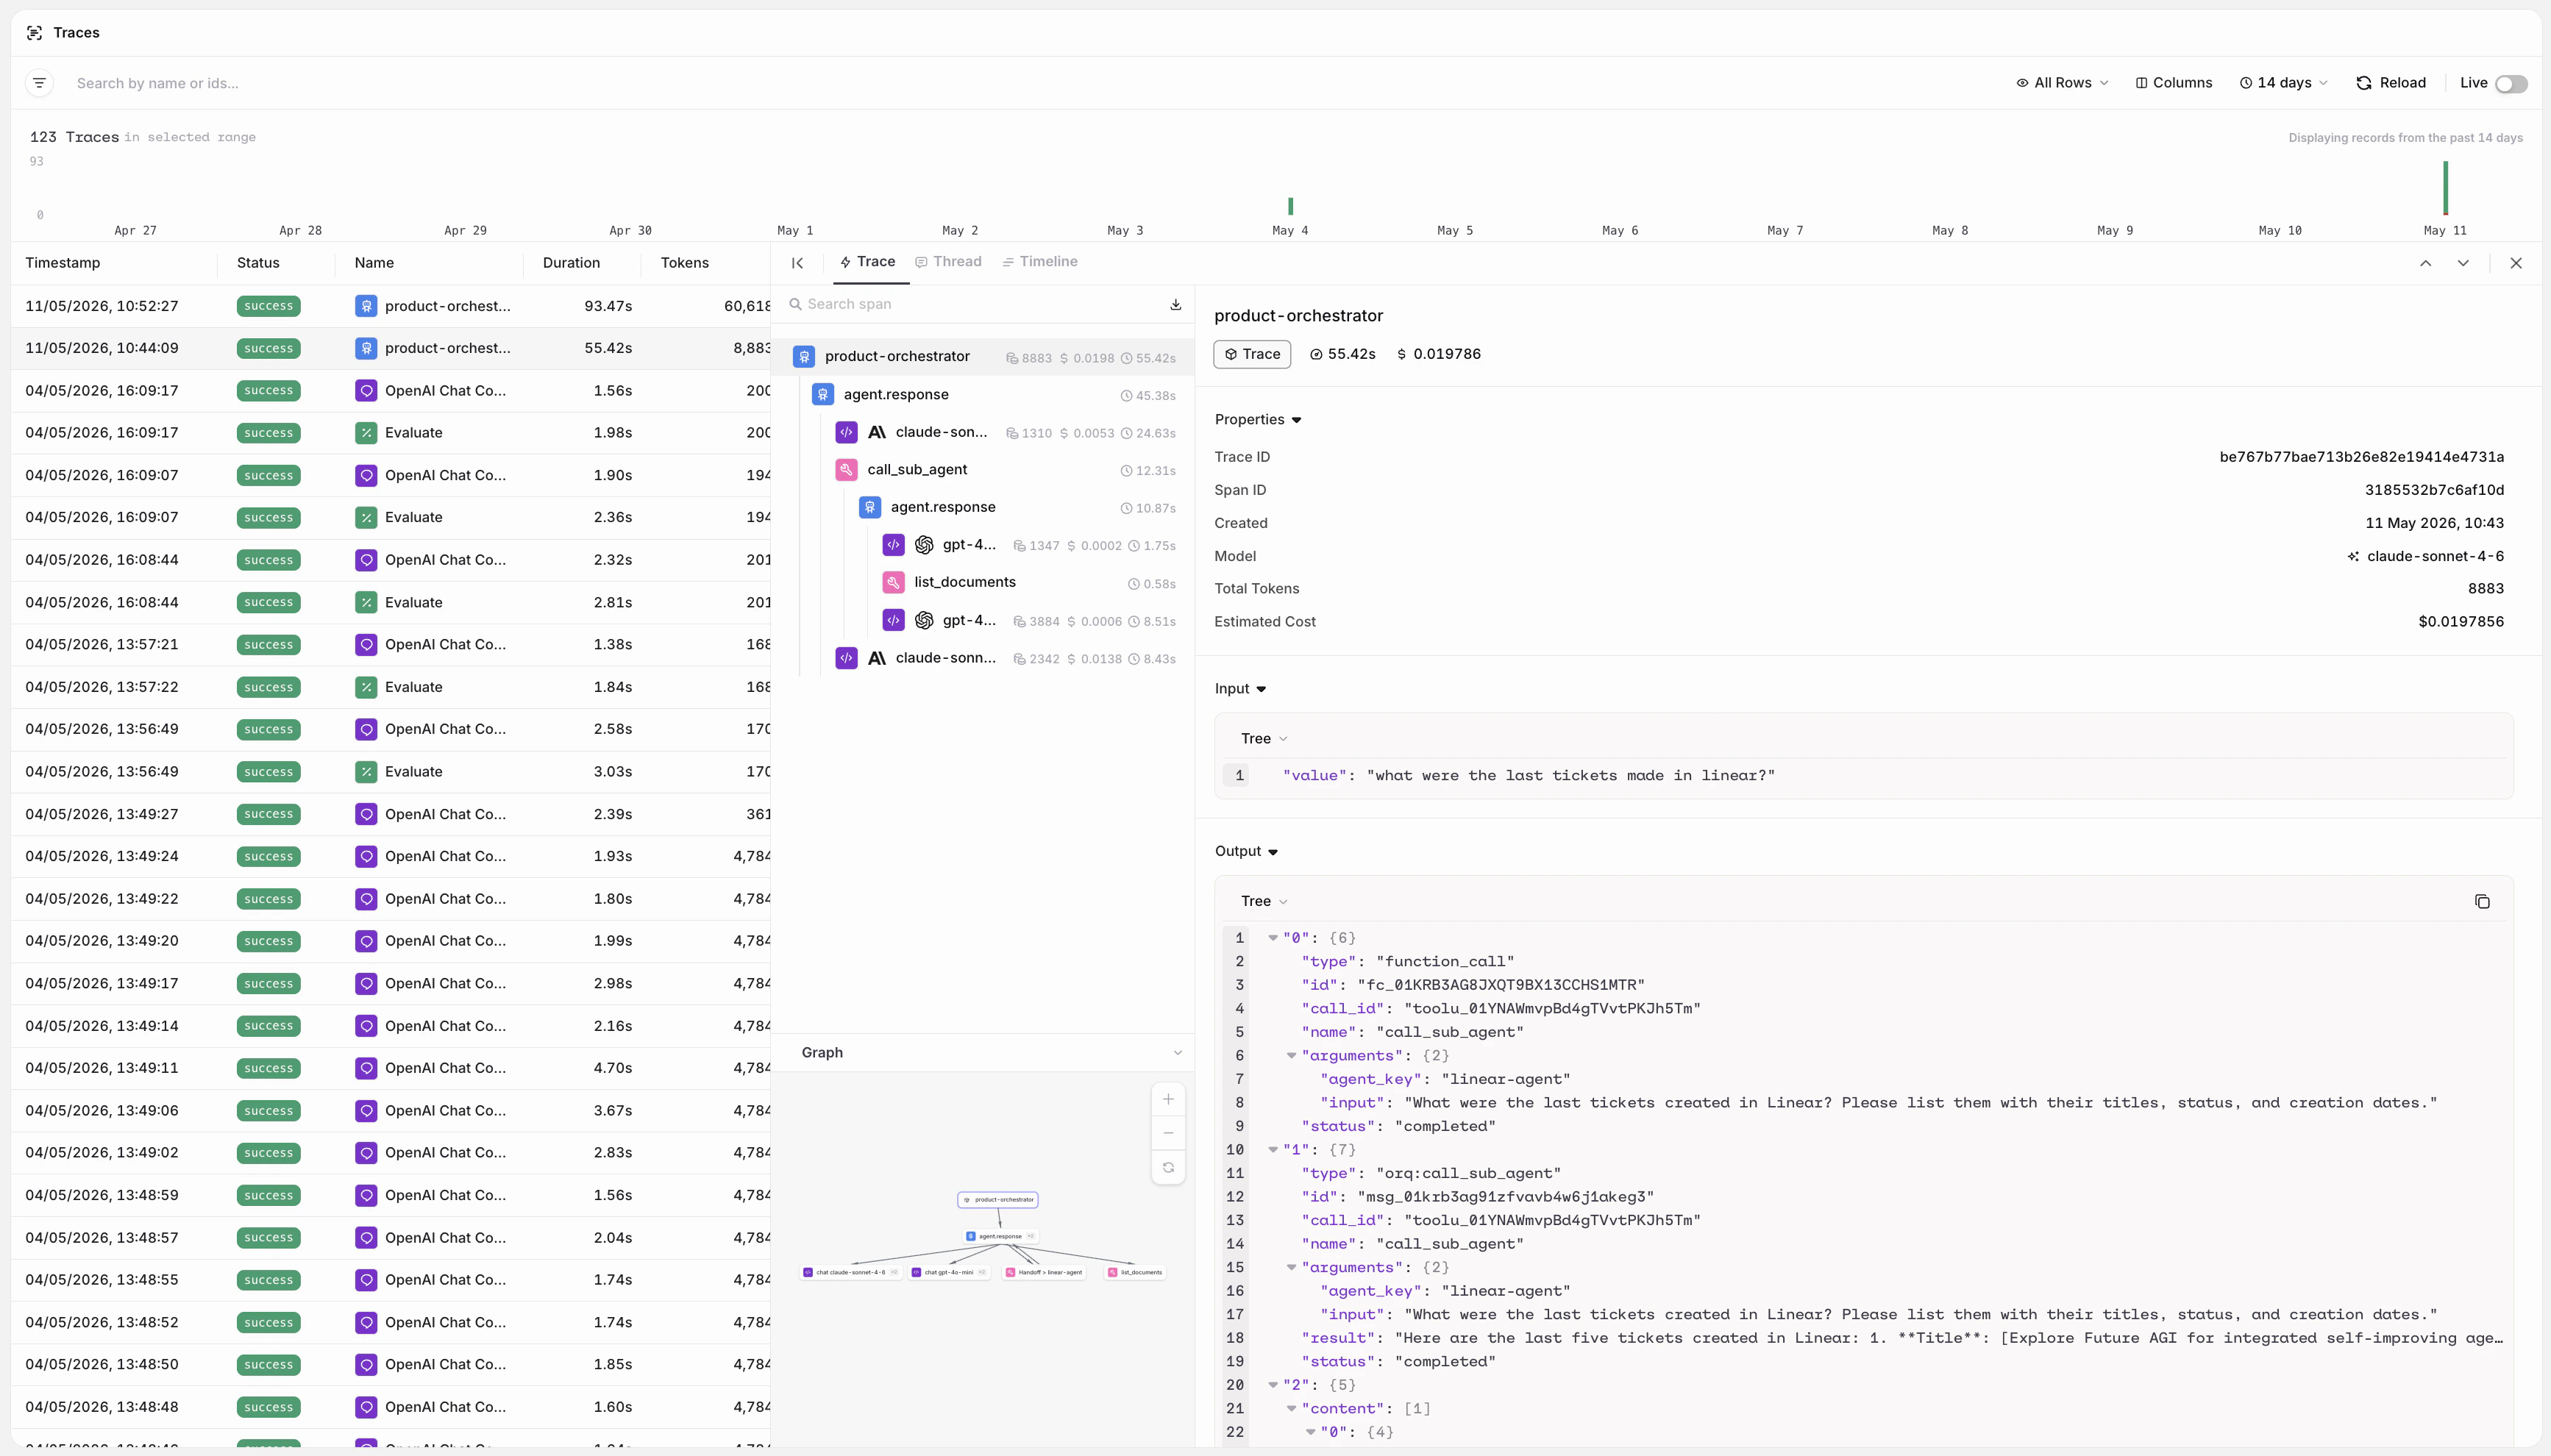
Manually evaluate responses using Annotations directly on individual spans. Annotations defined in the project are available on all spans automatically. Learn more in Annotations.
Search and Time Range
The search box matches part of a trace ID, thread ID or session ID, and the name, span ID, model, provider, agent name or tool name of any span in the trace. Matching is case-insensitive. Select the time range picker to choose a preset from 5 mins to 90 days, or set a Start date and End date for a custom range. Presets longer than the workspace’s data retention are disabled. The last preset used is remembered for the next visit.Viewing Errors
Traces that encountered an error show a red error status badge in the list, and are counted as Errors in the activity chart. Add a Status filter with the valueerror to scope the list to errors only.
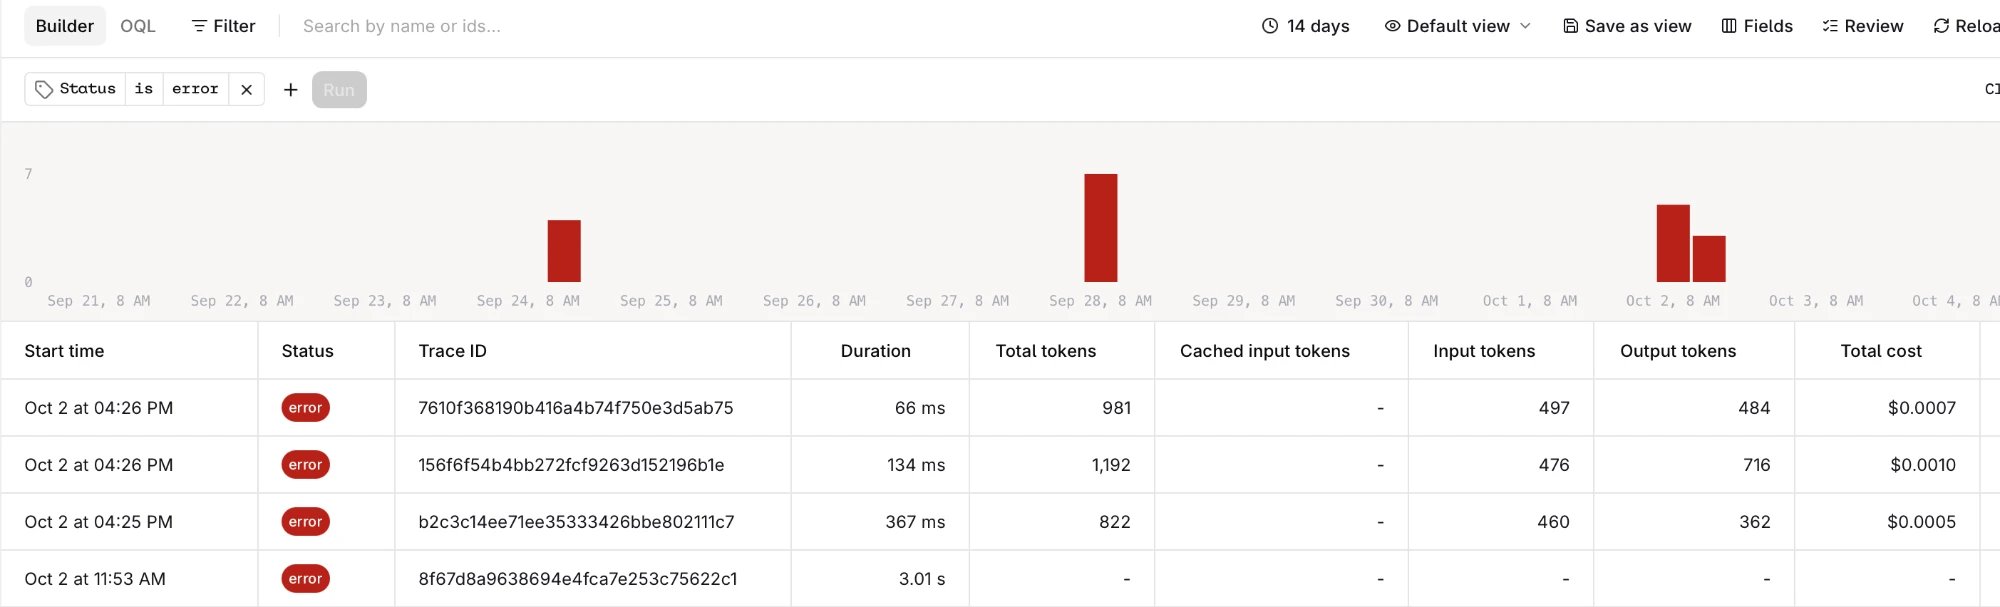
Traces list filtered to error status.
- Filter by Status
errorand an Identity to see all errors for a specific user. - Combine with Project or a metadata field to narrow down failures to a particular environment or deployment.
Filtering Traces
- Click Filter in the query bar.
- Select a field. Search the list to find it faster. Common fields such as Status, Model and Trace name are listed first, followed by the attributes and metadata fields found in the workspace’s traces.
- Select an operator, for example
==,!=,contains,in,betweenoris empty. - Pick a suggested value or type one, then click Filter.
- Click a chip to change its operator or value, or click to remove it.
- Click to add another filter.
- With two or more filters, choose and to match all of them or or to match any of them.
- Changes to the filters wait until Run is clicked. Clear removes all filters at once.
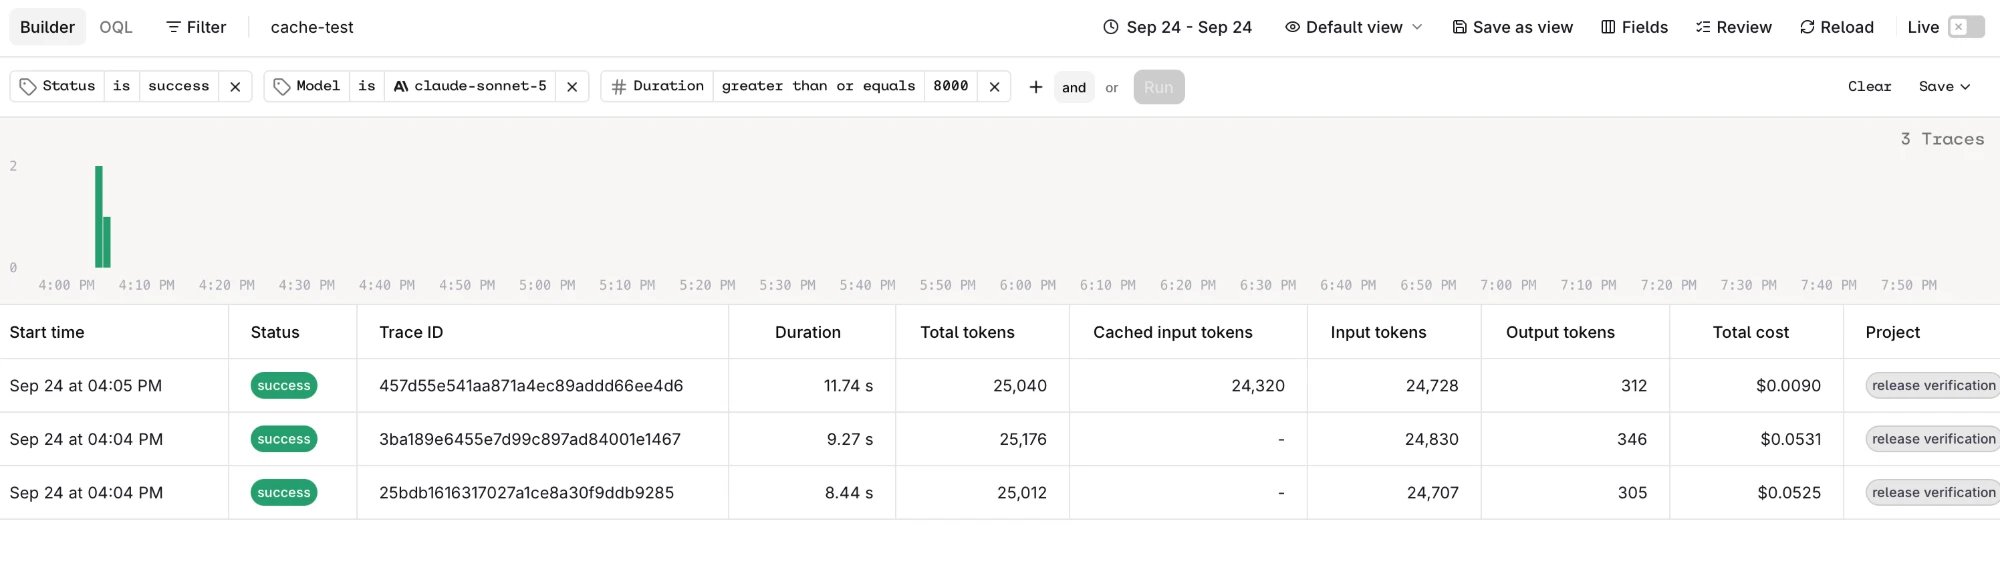
Traces filtered by status, model and duration.
When working with Agents, access traces directly from the Agent page with automatic filtering for that specific agent.
Filter grammar
The Search traces and Search logs APIs take afilters array alongside the free-text query. Each entry is one condition:
filter_operator combines the entries with and (default) or or. A request accepts up to 20 filters. from and to are required and bound the search window; sort, limit, and page_token follow the Search traces reference for traces and the Search logs reference for logs.
The op values are eq, neq, in, not_in, gt, gte, lt, lte, between, contains, exists, and not_exists. The table lists the operators each type commonly accepts; a specific field may accept fewer or more:
between takes exactly two values, the lower bound first. exists and not_exists take no values.
Field-level support varies, so call GET /v3/traces/fields for the filter fields, their types, and the operators each one accepts. Log search uses the same filter object and operator vocabulary.
Configuring Columns
Click Fields to open the Fields panel and choose which columns the table shows. Every attribute and metadata field found in the workspace’s traces can be shown as a column, next to the built-in columns such as Start time, Status, Trace name, Duration, Total tokens, Total cost and Trace ID.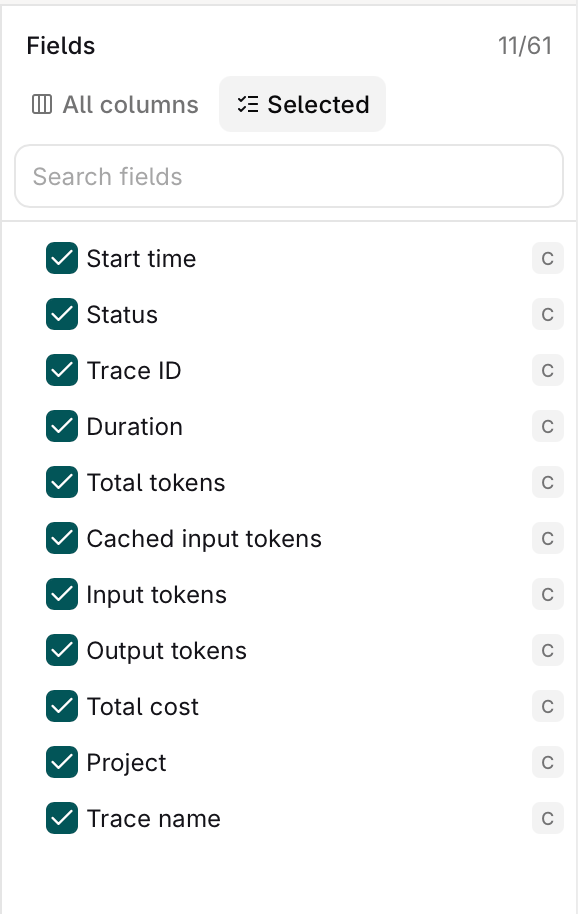
The Fields panel.
- Show or hide: check or uncheck a field. Search the panel to find a field by name.
- Reorder: switch to Selected and drag a field by to move its column. Reordering only works while all selected fields are visible, so clear the search box first.
- Resize: drag the right edge of a column header.
- Rename: open on an attribute or metadata column header and select Edit name to give it a display name.
- Remove: open on a column header and select Remove to hide it.
Creating Custom Views
A view saves the current filters, columns and column names under a name, to reopen them later from the Views dropdown. To create a view:- Set the filters and columns.
- Open Views and select Create new view.
- Enter a Name.
- Optionally check Make this view private for myself. Views are shared with workspace members by default.
- Click Create View.
- : set or unset it as the default view. The default view opens automatically on the Traces page.
- > Edit: change its name or privacy.
- > Share: copy a link that opens the view with its filters.
- > Delete: delete the view.
Views saved on the previous Traces page were moved to the new page. Filters that the new page cannot express were adjusted or removed.
Review Traces
Click Review in the toolbar to open the review screen and step through traces one by one. Applying one or more filters first narrows the review queue to matching traces; with no filter active, Review steps through the current list.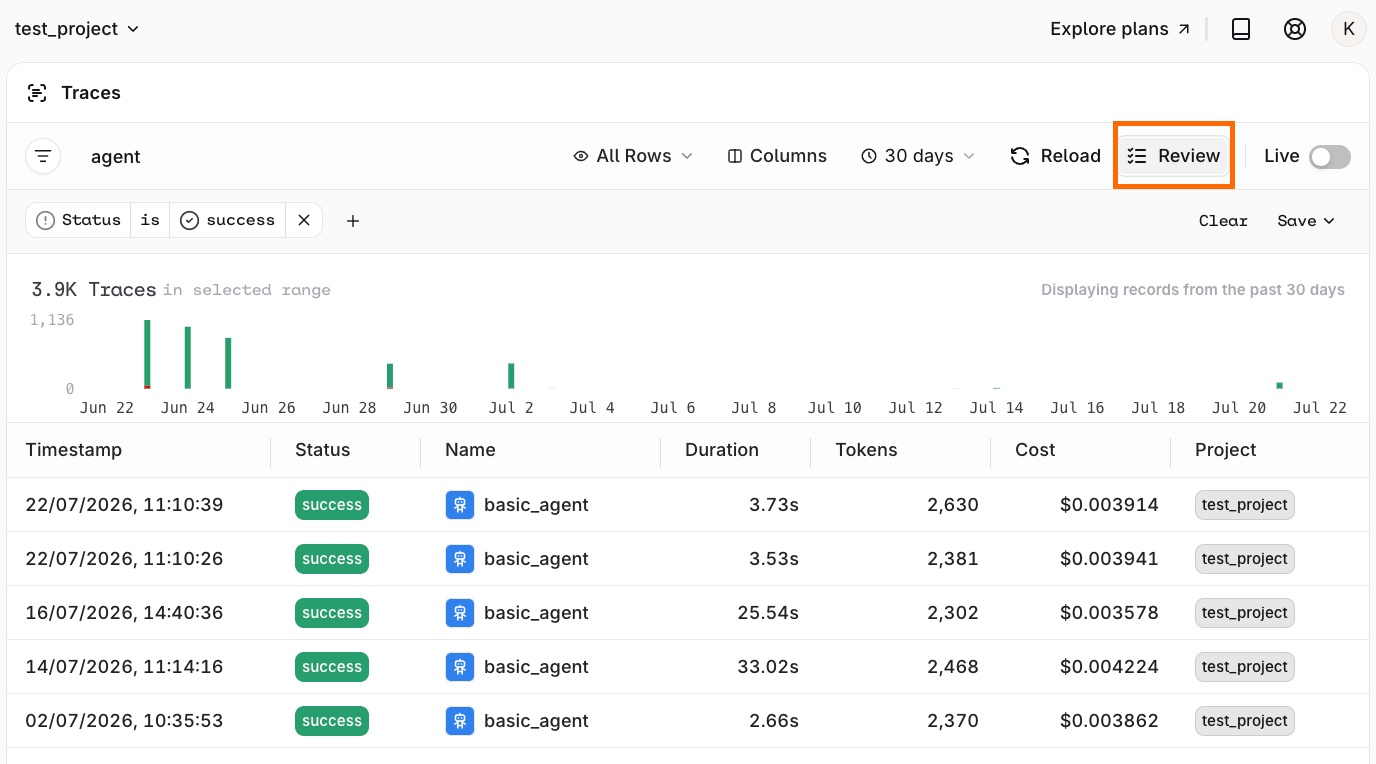
The review screen for Traces.
- Left: Inputs and Metrics for the selected span.
- Center: Full trace conversation.
- Right: Annotation controls for manual review. Select in the Annotations panel header to create a new annotation without leaving the screen.
Correct an Evaluator Result
Hover an Evaluator result to reveal a , and select it to open a popover with:- Value: the corrected result, matching the Evaluator’s own output type (a toggle for boolean Evaluators, a text or number field otherwise).
- Explanation: an optional comment.
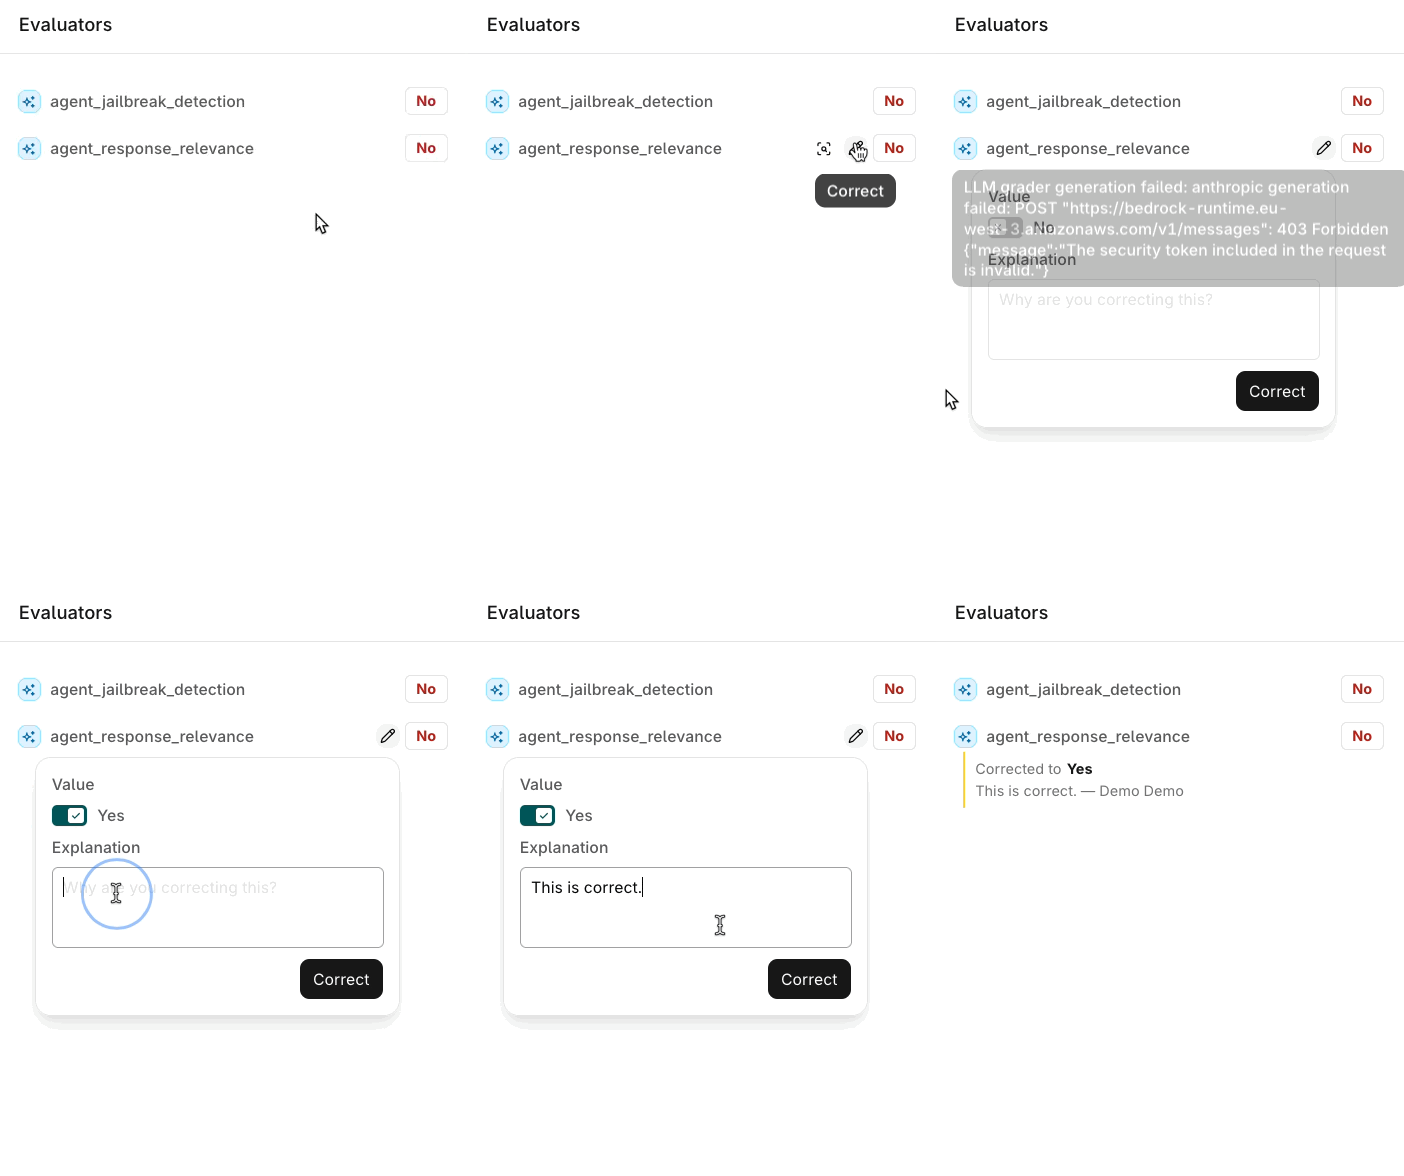
Correcting an Evaluator result in the Traces review screen.
This corrects the Evaluator’s result, not the AI response text. For rewriting the response itself, use the Logs Add a Text Correction flow.
See Correct an Evaluator Result in the API & SDK tab for the API/SDK equivalent.
Threads
Threads
Visualize conversation history as Threads to follow the full sequence of messages across an agent session.
Reference
Token and Cost Tracking
How token usage is captured and cost is calculated per LLM request.
Span Attributes
Complete reference for all
orq.* span attributes emitted on traces, webhook payloads, and trace exports.